
Stocks Take A Breather After G20 Meeting
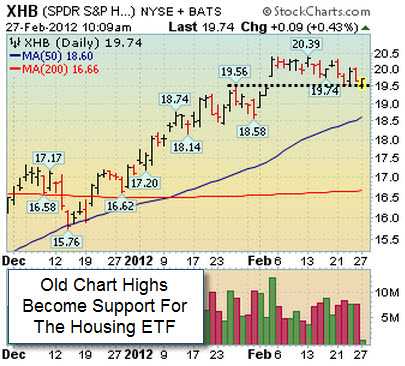
XHB- Old Chart Highs Become Support

Monday, February 27, 2012
Stock Market Commentary:

Stocks and a slew of other risk assets ended mixed after the G-20 concluded said that European countries should sort their finances out on their own. From our point of view, the major averages confirmed their latest rally attempt on Tuesday 1.3.12 which was Day 9 of their current rally attempt. It was also encouraging to see the S&P 500 break above its downward trendline and its longer term 200 DMA line. Looking forward, the S&P 500 has done a great job staying above its Q4 2011 high (~1292) and is now doing its best to stay above 1356 which corresponds with July’s high. The next level of resistance is 2011’s high just above 1370. The bulls remain in control as long as the benchmark S&P 500 trades above 1292 and then its 200 DMA line. Leadership continues to improve which is another healthy sign

G-20 Does Not Rescue Europe; Pending Home Sales Surge In The U.S.:

Over the weekend, the G-20 concluded their latest meeting in Mexico and told European leaders that they need to resolve their fiscal woes on their own. Initially, this put a little pressure on equities and other risk assets and added pressure on Germany, Europe’s largest economy, to save the so-called PIIGS. Euro zone countries are going to reassess the strength of their bailout fund in March. Until then, the ECB’s LTRO program appears to be picking up the slack. In the U.S., pending home sales surged +8.0% vs. January 2011 and hit a two-year high. Again, as we have said several times in this column, housing stocks appeared to have bottomed and look great here.

Market Outlook- Confirmed Rally

Risk assets (stocks, FX, and commodities) have been acting better since the latter half of December and are extended by any normal measure. All this means is that the odds for a pullback increase. However, markets can very easily go from overbought to extremely overbought. As always, keep your losses small and never argue with the tape. If you are looking for specific help navigating this market, feel free to contact us for more information. That’s what we are here for!

Similar Posts

  • Support Now Becomes Resistance

    Market Outlook- Market In A Correction:
    From our point of view, the market is back in a correction now that all the major averages closed below their respective 50 DMA lines and important upward trendlines. Since the beginning of May, we have urged our clients and readers to be extremely cautious as the major averages and a host of commodities began selling off.
    For those of you that are interested, the S&P 500 hit a new 2011 high on May 2, 2011. Two days later, on Wednesday, May 4, 2011, we turned cautious and said “The Rally Was Under Pressure” (read here). Then on Monday, 5.23.11, we changed our outlook to “Market In A Correction” (read here). On Monday June 6, 2011 we pointed out that the S&P 500 violated its 9-month upward trendline (read here) and reiterated our cautious stance. We have received a lot of “thank you” emails for being “spot on” and our cautious approach. We are humbled by your presence and very thankful for your continued support. Looking forward, the next level of resistance for the major averages is their respective 50 DMA lines then their 2011 highs. The next level of support is their longer term 200 DMA lines. If you are looking for specific help navigating this market, please contact us for more information.
    Stock Market Research?
    Global Macro Research?
    Want To Follow Trends?
    Learn How We Can Help You!

  • Week-In-Review: Stocks Stall Below Major Resistance

    Stocks Stall Below Major Resistance As Earnings Season Begins Stocks opened the week higher but stalled mid-week and closed mixed to lower after sellers showed up in the latter half of the week. Several important areas of the market, that had been leading for months, are now in “pullback mode” as we enter the heart of earnings season….

  • Stocks End Holiday Week Higher

    Looking forward, the window is now open for disciplined investors to begin carefully buying high-ranked stocks again. It was encouraging to see a flurry of high-ranked leaders trigger fresh technical buy signals and break out of sound bases in recent sessions. The next important level to watch for the major averages are their respective 200-day moving average (DMA) lines. It is important to note that approximately 75% of FTDs lead to new sustained rallies, while 25% fail. In addition, every major rally in market history has begun with a FTD, but not every FTD leads to a new rally. Trade accordingly