Economic Data Weighs On Stocks

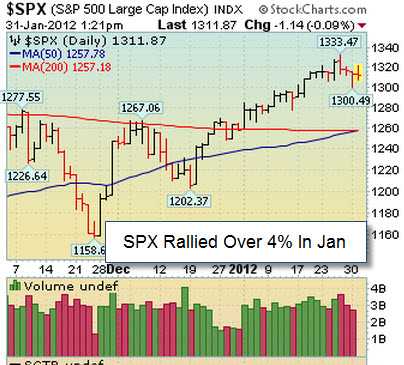
SPX Rallied Over 4 Percent in Jan

Tuesday, January 31, 2012
Stock Market Commentary:

Stocks and a slew of other risk assets were quit on the last trading day of the month as investors digested the latest round of economic and earnings data. From our point of view, the major averages confirmed their latest rally attempt on Tuesday 1.3.12 which was Day 9 of their current rally attempt. It was also encouraging to see the S&P 500 break above its downward trendline and its longer term 200 DMA line. Looking forward, the S&P 500 is doing its best to stay above its Q4 2011′s high (~1292) and now has its sights set on its 2011 high near 1370. In addition, the bulls remain in control as long as the benchmark S&P 500 trades above 1292 and then its 200 DMA line.

Weak End To Strong Month:

On Tuesday, stocks were quiet as investors digested the latest round of earnings and economic data. News on the economic front was less than stellar. The S&P/Case-Shiller index fell -1.3% in November which missed the Street’s estimate for a decline of -0.5%. Elsewhere, the Conference Board said consumer confidence unexpectedly declined in January, The index fell to 61.1, missing the Street’s estimate of 68. The Institute of Supply Management said its Chicago business barometer fell to its lowest level since August which is not ideal. Earnings continued to be released in droves with most companies meeting or slightly passing analysts estimates. After all was said and done, stocks and a slew of other risk assets (commodities and currencies) rallied in January, which bodes well for the global economy.

Market Outlook- New Rally Confirmed

Risk assets (stocks, FX, and commodities) have been acting better since the latter half of December. Now that the major U.S. averages scored a proper follow-through day the path of least resistance is higher. Looking forward, one can err on the long side as long as the benchmark S&P 500 remains above support (1292). Leadership is beginning to improve which is another healthy sign. Now that the 200 DMA line was taken out it will be important to see how long the market can stay above this important level. If you are looking for specific help navigating this market, feel free to contact us for more information. That’s what we are here for!

Similar Posts

  • Week 1 of 2010; Stocks Rally

    However, after all was said and done, stocks remain strong as investors digested the latest round of economic data. The benchmark S&P 500, Dow Jones Industrial Average, NYSE composite, mid-cap S&P 400, small-cap Russell 2000 and small-cap S&P 600 indices all enjoyed fresh recovery closing highs in the first week of 2010 and the tech heavy Nasdaq composite closed right near its respective high. The current rally just ended its 44th week (since the March 12, 2009 follow-through day) and on all accounts still looks very strong. In addition, most bull markets last for approximately 36 months, so the fact that we are beginning our 10th month suggests we have more room to go. Until support is broken (50 DMA lines for the major averages) this rally deserves the bullish benefit of the doubt.

  • Weak Economic Data; Stocks Still Below 50 DMA Line

    Market Outlook- Market In A Correction
    From our point of view, the market is in a correction as a new downtrend has formed and the 50 DMA line is broken for many of the major averages. Since the beginning of May, we have urged caution as the major averages and a host of commodities began selling off. Looking forward, the next level of support is the 9-month upward trendline and the next level of resistance is the 50 DMA line and then the 2011 highs. If you are looking for specific help navigating this market, please contact us for more information.
    Want Better Results?
    You Need Better Ideas!
    We Know Markets!
    Learn How Our Consulting Services Can Help You!

  • Weak Economic Data Drags Stocks Lower

    Monday marked Day 2 of a new rally attempt which means the earliest a possible follow-through day (FTD) could emerge will be Wednesday. However, if at anytime, Friday’s lows (Day 1) are breached then the day count will be reset. The technical action in the major averages has recently been weak while the latest round of economic data has provided a poor outlook for the market and the global recovery. Currently, resistance for the the major averages are their 50-day moving average (DMA) lines, then their longer-term 200 DMA lines while support remains July’s lows. It is also disconcerting to see weakness in the financial group. Meanwhile, the action in leading stocks and fact that some high-ranked leaders are breaking out of sound bases can be considered somewhat encouraging. Still there is importance in remaining cautious until the major averages are back in a confirmed uptrend. Put simply, we can expect this sideways/choppy action to continue until the market breaks out above resistance or below support. The first scenario will have bullish ramifications while the second will be clearly bearish. Trade accordingly.

  • Quiet Day On Wall Street

    Heretofore, the action since this rally was confirmed on the September 1, 2010 follow-through day (FTD) has been strong but the market action has been wide-and-loose which is not a healthy sign. The S&P 500 sliced below its two month upward trendline (shown above) which is not ideal. The next level of support for the major averages is their September highs, then their respective 200-day moving average (DMA) lines while the next level of resistance is their respective April highs. We have enjoyed large gains since the September 1st FTD and for the first time, the tape is getting sloppy. Trade accordingly.

  • Week In Review: Tug Of War Continues On Wall Street

    Tug of War Continues In the short term, the large topping pattern continues to form. The top will be confirmed if/when the major averages break below support of their large bases. The tale of two tapes continues to unfold as the S&P 500 (SPX) and the Dow Jones Industrial Average (DJIA) continue to outperform the Nasdaq…

  • CNBC: Dow closes down triple digits; S&P in correction

    Wednesday Jan 13, 2016 4:00pm EST U.S. stocks closed sharply lower Wednesday, pressured by low oil prices, as concerns about global economic slowdown weighed ahead of major earnings reports. The S&P 500 closed down 2.5 percent, ending below the psychologically key 1,900 level for the first time since Sept. 29. The index fell below that level…