Stocks Quiet On Healthy Economic Data

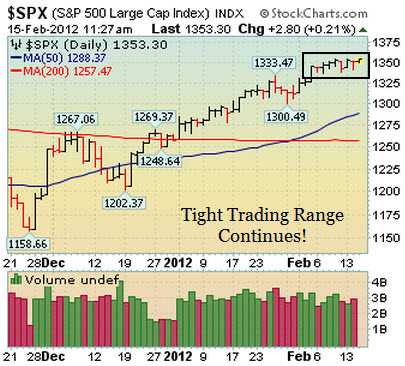
SPX- Tight Trading Range Continues

Wednesday, February 15, 2012
Stock Market Commentary:

Stocks and a slew of other risk assets were quiet on Wednesday as the latest round of mostly stronger than expected economic and earnings data was released. From our point of view, the major averages confirmed their latest rally attempt on Tuesday 1.3.12 which was Day 9 of their current rally attempt. It was also encouraging to see the S&P 500 break above its downward trendline and its longer term 200 DMA line. Looking forward, the S&P 500 has done a great job staying above its Q4 2011 high (~1292) and is flirting with 1356 which corresponds with July’s high. The next level of resistance is 2011’s high just above 1370. The bulls remain in control as long as the benchmark S&P 500 trades above 1292 and then its 200 DMA line.

FOMC Minutes Released, Home Builder Confidence, France & Germany’s GDP, and Empire State MFG survey Beat Estimates:

Stocks were relatively quiet on Wednesday even though futures were pointing to a stronger open. The economic data topped estimates. The National Association of Home Builder’s said its monthly sentiment index rose 4 points to 29, which was its highest reading in four years. Even though the report is trending higher, it is still below the critical 50 level which separates outright positive and negative sentiment. The Empire State survey, which measures manufacturing in the state of New York, topped estimates and rose to 19.53 in February which is another bullish feather in the economy’s cap. The minutes of the latest FOMC meeting were released and largely reiterated their recent publicly stated stance of cautious optimism. Finally, France and Germany’s gross domestic product (GDP) beat estimates. Germany’s GDP, Europe’s largest economy, fell by -0.2% which beat the -0.3% estimate. Meanwhile, France’s GDP, Europe’s second largest economy, rose by +0.2% which matched estimates.

Market Outlook- New Rally Confirmed

Nearly all risk assets are extended by any normal measure and are due for a pullback to consolidate their recent gains. The key is to ascertain the “health” of the pullback to see if it is a short pause in a new uptrend or the beginning of a new downtrend. Risk assets (stocks, FX, and commodities) have been acting better since the latter half of December. Now that the major U.S. averages scored a proper follow-through day the path of least resistance is higher. Looking forward, one can err on the long side as long as the benchmark S&P 500 remains above support (1292). Leadership is beginning to improve which is another healthy sign. Now that the 200 DMA line was taken out it will be important to see how long the market can stay above this important level. If you are looking for specific help navigating this market, feel free to contact us for more information. That’s what we are here for!

Similar Posts

  • Stocks Plunge Below 200 DMA line On Heavy Volume

    At this point, all the major averages sliced and closed below their respective 200 DMA lines which suggests lower prices will likely follow. Furthermore, the NYSE composite undercut its Thursday, May 6, 2010 low (Flash crash) which bodes poorly for this market. In addition, all the major averages are now down over -10% from their late April highs which is the first time that occurred since the March 2009 low. On Wednesday, all the major averages undercut their recent lows which means the day count was reset and we are now looking for Day 1 of a new rally attempt to occur. What does all of this mean for investors? Simple, the market remains in a correction which reiterates the importance of adopting a strong defense stance until a new rally is confirmed. Trade accordingly.

  • Debt Woes Smack The Euro

    Market Outlook- Uptrend Under Pressure:
    The last week of June’s strong action suggests the market is back in a confirmed rally. As our longstanding clients/readers know, we like to filter out the noise and focus on what matters most: market action. That said, the current rally is under pressure as investors patiently await earnings season and continue to digest the latest economic data. Until the major averages violate their respective 50 DMA lines on a closing basis, the market deserves the bullish benefit of the doubt. If you are looking for specific help navigating this market, please contact us for more information.
    Stock Market Research?
    Global Macro Research?
    Want To Follow Trends?
    Learn How We Can Help You!

  • Stocks Tank On Tepid Jobs Report; Euro Plunges To A New Multi-Year Low!

    The author of “How To Make Money In Stocks”, the book that explains the fact-based investment system, has observed in the past that a market should not be considered to be in “healthy” shape unless at least 2 of the 3 major averages are trading above their rising 200-day moving average (DMA) lines. Only the Nasdaq Composite Index is currently above its long-term average, meanwhile the S&P 500 and Dow are encountering resistance. It would be very encouraging to see a proper follow-through-day (FTD) emerge for the benchmark S&P 500 and the Dow Jones Industrial Average to offer additional confirmation of a hearty new rally. Yet, acknowledging that we have a new confirmed rally based on the latest market improvements, the window is now considered to be open again to begin buying high-ranked stocks that trigger new technical buy signals but caution is sometimes the better part of valor.

  • Stocks End Mixed On Healthy Economic Data

    The fact that there have only been three distribution days since the follow-though-day (FTD) bodes well for this nascent rally. It is also a welcome sign to see the market continue to improve as investors digest the latest round of stronger than expected economic and earnings data. Remember that now that a new rally has been confirmed, the window is open to proactively be buying high quality breakouts meeting the investment system guidelines. Trade accordingly.

  • Stocks Fall As Rally Cools

    Market Outlook- Market In A Confirmed Rally
    From our point of view, the market is back in “rally-mode” as all the major averages continue to trade above their respective 50 DMA lines and recent chart highs. In addition, leading stocks have held up very well even as the major averages slid below their respective 50 DMA lines in mid-April which is another encouraging sign. If you are looking for specific help navigating this market, please contact us for more information.
    Want Better Results?
    You Need Better Ideas!
    We Know Markets!
    Learn How We Can Help You!