
Week-In-Review: Bullish Action Ahead Of The Long Weekend
Bullish Action Ahead Of The Long Weekend

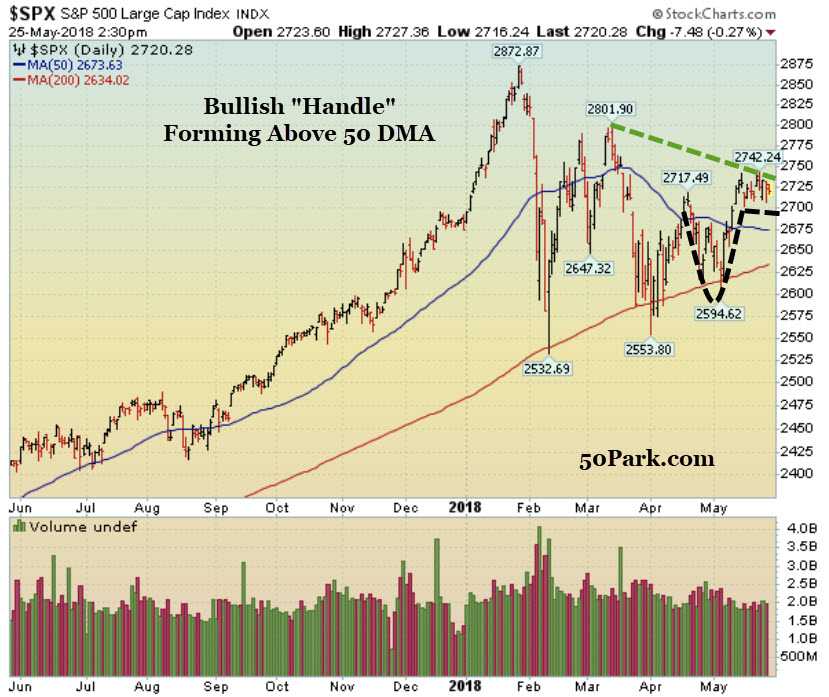
The market had every chance in the world to fall last week and the fact that it didn’t is very bullish. Remember, it’s not the news that matters but how the market reacts to the news. When a market doesn’t fall on bearish news that is a bullish event and when a market can’t rally on bullish news that is a bearish event. Right now, the small-cap Russell 2000 is trading at a new all-time high which is also bullish for the broader market. The other popular indices are all tracing out a bullish “handle” just above their respective 50 DMA lines. Near-term support is the 50 DMA line and as long as that level is defended, odds favor higher prices will follow. Moreover, one or two “good” days and the market can easily begin a new leg higher. The bulls remain in clear control until any serious selling shows up. 

Mon-Wed Action:

Stocks opened higher on Monday after Treasury Secretary Steven Mnuchin said the so-called trade war with China is placed ‘on hold.’ The U.S. suspended its threat to impose tariffs on $150 billion in Chinese imports while the negotiations with China continue. President Trump does have the option to impose the tariffs if he’s not happy with the way things are moving along. On Tuesday, stocks fell 200 points after President Trump said the North Korea summit may not happen and that he was not happy with China’s trade talks. In other news, retailers were mixed to mostly lower after Kohl’s reported earnings. On Wednesday, stocks fell at the open but turned higher after the Fed minutes were released. Overnight, the so-called “risk-off” trade spread in Asia and the Turkish Lira plunged. Buyers showed up in the U.S. and protected support (50 DMA line for the major indices). Additionally, the Fed minutes came out and they were more dovish than expected and that helped lift the market. The Fed said it is willing to let inflation run above 2% for a while which is its way of saying, “easy money is here to stay.”

Thur & Fri Action:

On Thursday, stocks fell after Trump canceled the meeting with North Korea and the Commerce Department began looking into importing auto parts. In a bullish turn of events, stocks rallied back mid-day and the small-cap Russell 2000 actually closed higher. The fact the market didn’t fall on this bearish news is a bullish event. Remember, it’s not the news that matters, but how the market reacts to the news. So far, the action remains bullish. Stocks were quiet on Friday ahead of the long holiday weekend.

Market Outlook: Bullish Action

The small-cap Russell 2000 hit a new high which is bullish for the broader market. The other indices are tracing out a bullish handle and trading between important resistance (2018’s high) and important support (February’s low). Until either level is broken, I have to expect this sloppy, sideways action to continue. On the downside, the big level of support to watch is the 200 DMA line and then February’s low. For now, as long as those levels hold, the longer-term uptrend remains intact. Conversely, if those levels break, look out below. On the upside, resistance is now 2018’s high.  As always, keep your losses small and never argue with the tape. Free Special Report: Want A Bargain? 3 Cheap Stocks That Are About To Breakout

Similar Posts

  • Stocks Rally on Shortened Holiday Week

    Thursday, December 23, 2010 Stock Market Commentary: The major US averages edged higher on this shortened holiday week capping a fourth consecutive weekly gain for the Dow Jones Industrial Average and benchmark S&P 500, fifth weekly gain for the tech-heavy Nasdaq composite, and sixth consecutive weekly advance for the small-cap Russell 2000 index. It is…

  • Stocks Fall Amid Fresh EU Debt Woes

    Looking forward, the window is now open for disciplined investors to begin carefully buying high-ranked stocks again. It was encouraging to see a flurry of high-ranked leaders trigger fresh technical buy signals and break out of sound bases in recent sessions. The next important level to watch for the major averages are their respective 200-day moving average (DMA) lines. It is important to note that approximately 75% of FTDs lead to new sustained rallies, while 25% fail. In addition, every major rally in market history has begun with a FTD, but not every FTD leads to a new rally. Trade accordingly.

  • Dow Closes Below 50 DMA Line on Tepid Earnings & Economic Data

    The major averages and leading stocks are pulling back to digest their recent gains as investors make their way through the latest round of economic and earnings data. So far, the market’s reaction has been tepid at best which puts serious pressure on the current rally. Until a clear picture can be formed as to how companies fared last quarter, one could easily expect to see more of this sideways to lower action to continue. The market is in the middle of its46th week since the March lows and the rally remains intact, albeit under serious pressure from our point of view. The Dow Jones Industrial Average sliced and closed below its 50 DMA line on heavy volume for the first time since October which is an ominous sign. The Nasdaq and the S&P 500 closed above their respective 50 DMA lines which, in the near term, is a healthy sign. Now that the market is clearly under pressure one would be wise to adjust their exposure accordingly.

  • Global Economy Continues To Slow

    Market Outlook- Market In A Correction:
    From our point of view, the market is back in a correction now that all the major averages closed below their respective 50 DMA lines and important upward trendlines. Since the beginning of May, we have urged our clients and readers to be extremely cautious as the major averages and a host of commodities began selling off.
    For those of you that are interested, the S&P 500 hit a new 2011 high on May 2, 2011. Two days later, on Wednesday, May 4, 2011, we turned cautious and said “The Rally Was Under Pressure” (read here). Then on Monday, 5.23.11, we changed our outlook to “Market In A Correction” (read here). On Monday June 6, 2011 we pointed out that the S&P 500 violated its 9-month upward trendline (read here) and reiterated our cautious stance. We have received a lot of “thank you” emails for being “spot on” in our cautious approach. We are humbled by your presence and very thankful for your continued support. Looking forward, the next level of resistance for the major averages is their respective 50 DMA lines then their 2011 highs. The next level of support is their longer term 200 DMA lines. If you are looking for specific help navigating this market, please contact us for more information.
    Stock Market Research?
    Global Macro Research?
    Want To Follow Trends?
    Learn How We Can Help You!

  • Week-In-Review: Stocks Bounce As Investors Wait For A Tax Cut

    Stocks Bounce As Bulls Quell Bearish Pressure- For Now Stocks rallied last week after the narrative in D.C. shifted toward a tax cut. Technically, as long as Monday’s low holds, this appears to be another short-term and shallow pullback. The major indices are tracing out a new early entry (downward trendline) and a break above…

  • Small & Mid Cap Stocks Hit New All-Time Highs

    Friday, January 18, 2013 Stock Market Commentary: Stocks are back in a confirmed uptrend and continue to rally after the fiscal cliff was averted and congress decided to put the best interest of the country ahead of their petty bickering. Stocks remain perched near resistance (2012 highs) and the action is very healthy. Looking forward,…

Leave a Reply

Your email address will not be published. Required fields are marked *