
China Slows Down; Threatens Global Recovery
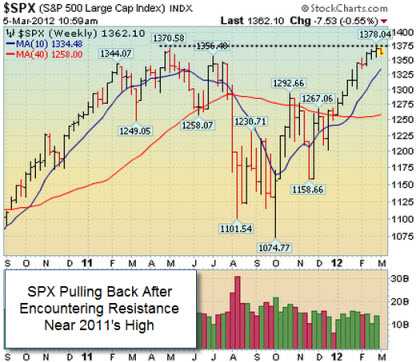
SPX Pulling Back After Encountering Resistance Near 2011's High

Monday, March 05, 2012
Stock Market Commentary:

Stocks were under pressure across the globe after China lowered its GDP forecast to 7.5% for 2012. From our point of view, the major averages confirmed their latest rally attempt on Tuesday 1.3.12 which was Day 9 of their current rally attempt. Since then, stocks have been enjoying a very strong uptrend. However, the benchmark S&P 500 encountered resistance above its 2011 high (1370) and is currently pulling back to consolidate its recent move. It would be perfectly normal and healthy to see a 5-9% pullback before a new leg higher begins. That would bring the S&P 500 down to 1310-1240. Until then, the bulls remain in control of this market as long as the benchmark S&P 500 stays above its 50 DMA line.

China Slows Down; Threatens Global Recovery, E.U. & U.S. Economic Data Tops Estimates:

Before Monday’s open, China lowered its 2012 GDP figures to an 8-year low of 7.5% which sent a slew of risk assets (mainly stocks and commodities) lower across the globe. For the better part of the last decade China’s economy has been one of the strongest in the world, especially after the 2008-2009 financial crisis. Therefore, if China’s economy begins to slowdown and we get another “shock” to the global economy, the ongoing (and fragile) global recovery could be in real jeopardy. In Europe, retail sales snapped a four month losing streak, topped estimates, and unexpectedly rebounded in January. Sales rose +0.3%from December, after falling by half a percentage point at the end of 2011. Economic data in the U.S. topped estimates. The ISM’s service index rose to 57.3 last month which topped estimates and was above the boom/bust line of 50. The Commerce Department said factory orders slid -1% in January which was the largest decline in over a year but still came in above estimates for a decline of -1.5%.

Market Outlook- Confirmed Rally

Risk assets (stocks, FX, and commodities) have been acting better since the latter half of December and are extended by any normal measure. At this point, all this means is that the odds for a pullback increase. However, markets can very easily go from overbought to extremely overbought so trade accordingly. As always, keep your losses small and never argue with the tape. If you are looking for specific help navigating this market, feel free to contact us for more information. That’s what we are here for!

Similar Posts

  • Week-In-Review: Stocks End Week Mixed; Tech Stocks Fall – Again

    Stocks End Week Mixed; Tech Stocks Fall – Again Once again, we are entering a very split tape as investors sold leaders (tech stocks) and bought laggards for the second straight week. The Nasdaq and Nasdaq 100, which were leading the market for all of 2017, fell last week as the Dow Jones Industrial Average…

  • 15-Week Rally Continues!

    Market Action- Market In Confirmed Rally Week 15
    It is encouraging to see the bulls show up and defend the 50 DMA lines for the major averages. The market remains in a confirmed rally until those levels are breached. The tech-heavy Nasdaq composite and small-cap Russell 2000 indexes continue to lead evidenced by their shallow correction and strong recovery. Put simply, stocks are strong. Trade accordingly. If you are looking for specific high ranked ideas, please contact us for more information.

  • Another Weekly Gain On Wall Street

    The Dow Jones Industrial Average and the NYSE Composite Index have traded above resistance at their long term 200-day moving average (DMA) lines and recent chart highs. The tech-heavy Nasdaq Composite, benchmark S&P 500, and small-cap Russell 2000 index still remain slightly below their recent chart highs. However, the fact that all of the major averages are trading above their respective 2-month downward trendlines bodes well for this five week rally. In order for a new leg higher to begin, all the major averages must close and remain above their respective resistance levels. Remember that the window remains open for for high-ranked stocks to be accumulated when they trigger fresh technical buy signals. Trade accordingly.

  • Support Now Becomes Resistance

    Market Outlook- Market In A Correction:
    From our point of view, the market is back in a correction now that all the major averages closed below their respective 50 DMA lines and important upward trendlines. Since the beginning of May, we have urged our clients and readers to be extremely cautious as the major averages and a host of commodities began selling off.
    For those of you that are interested, the S&P 500 hit a new 2011 high on May 2, 2011. Two days later, on Wednesday, May 4, 2011, we turned cautious and said “The Rally Was Under Pressure” (read here). Then on Monday, 5.23.11, we changed our outlook to “Market In A Correction” (read here). On Monday June 6, 2011 we pointed out that the S&P 500 violated its 9-month upward trendline (read here) and reiterated our cautious stance. We have received a lot of “thank you” emails for being “spot on” and our cautious approach. We are humbled by your presence and very thankful for your continued support. Looking forward, the next level of resistance for the major averages is their respective 50 DMA lines then their 2011 highs. The next level of support is their longer term 200 DMA lines. If you are looking for specific help navigating this market, please contact us for more information.
    Stock Market Research?
    Global Macro Research?
    Want To Follow Trends?
    Learn How We Can Help You!

  • Stocks Fall As Investors Digest A Slew Of Economic Data

    Stocks closed lower as investors digested a slew of economic data. Volume, a critical component of institutional demand, was mixed compared to Monday’s levels; higher on the Nasdaq and lower on the NYSE. The higher volume on the Nasdaq marked a distribution day for that exchange but the lower volume on the NYSE helped those indexes avoided that fate. Decliners led advancers by over a 21-to-17 ratio on the NYSE and by over a 16-to-11 ratio on the Nasdaq exchange. There were 12 high-ranked companies from the CANSLIM.net Leaders List making a new 52-week high and appearing on the CANSLIM.net BreakOuts Page, higher from the 41 issues that appeared on the prior session. In terms of new leadership, it was encouraging to see new 52-week highs outnumber new 52-week lows on the NYSE and Nasdaq exchange.