
Greek Misses Deadline For 2nd EU/IMF Bailout
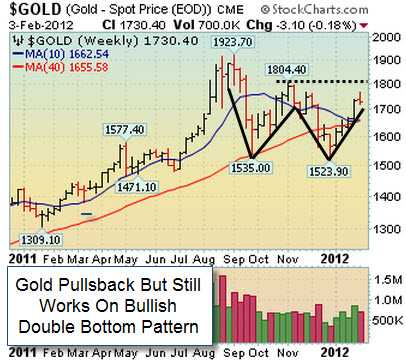
Gold- Pulls Back But Double Bottom Continues

Monday, February 06, 2012
Stock Market Commentary:

Stocks and a slew of other risk assets were relatively quiet after Greece missed its latest deadline for a second bailout package from the EU and the IMF. From our point of view, the major averages confirmed their latest rally attempt on Tuesday 1.3.12 which was Day 9 of their current rally attempt. It was also encouraging to see the S&P 500 break above its downward trendline and its longer term 200 DMA line. Looking forward, the S&P 500 is doing its best to stay above its Q4 2011′s high (~1292) and now has its sights set on its 2011 high near 1370. In addition, the bulls remain in control as long as the benchmark S&P 500 trades above 1292 and then its 200 DMA line.

Greece Misses Deadline For Second Bailout Package:

Before Monday’s open, stocks in Europe fell after Greece missed another deadline to receive a second bailout package from the EU and the IMF. Greek officials were supposed to reply by noon in Brussels to the European Union on new and difficult terms for a second bailout package.

Market Outlook- New Rally Confirmed

Risk assets (stocks, FX, and commodities) have been acting better since the latter half of December. Now that the major U.S. averages scored a proper follow-through day the path of least resistance is higher. Looking forward, one can err on the long side as long as the benchmark S&P 500 remains above support (1292). Leadership is beginning to improve which is another healthy sign. Now that the 200 DMA line was taken out it will be important to see how long the market can stay above this important level. If you are looking for specific help navigating this market, feel free to contact us for more information. That’s what we are here for!

Similar Posts

  • Stocks Flirting With Support

    Market Outlook- Market In A Correction:
    From our point of view, the market is back in a correction now that all the major averages closed below their respective 50 DMA lines and important upward trendlines. Since the beginning of May, we have urged our clients and readers to be extremely cautious as the major averages and a host of commodities began selling off. Looking forward, the next level of resistance for the major averages is their recent lows (i.e. 1294 in the S&P 500) and then their respective 50 DMA lines. The next level of support is their longer term 200 DMA lines and then their March 2011 lows.
    For those of you that are interested, the S&P 500 hit a new 2011 high on May 2, 2011. Two days later, on Wednesday, May 4, 2011, we turned cautious and said “The Rally Was Under Pressure” (read here). Then on Monday, 5.23.11, we changed our outlook to “Market In A Correction” (read here). On Monday June 6, 2011 we pointed out that the S&P 500 violated its 9-month upward trendline (read here) and reiterated our cautious stance. We have received a lot of “thank you” emails for being “spot on” in our cautious approach. We are humbled by your presence and very thankful for your continued support. If you are looking for specific help navigating this market, please contact us for more information.
    Stock Market Research?
    Global Macro Research?
    Want To Follow Trends?
    Learn How We Can Help You!

  • Quiet Day On Wall Street; Commodities Rally:

    Monday was a quiet day on Wall Street as gold and silver soared. In the future, to avoid any confusion, we are no longer going to use outside resources to label the market. A popular outside source changed their label on Friday to Market in a confirmed rally, without a proper FTD emerging. This is bizarre and frankly plain irresponsible. From our standpoint, the rally that began on September 1, 2010 is still intact and we said that in our commentary on November 16, 2010 when the outside source said the rally ended. Full Story here. If anyone has any questions about this, please feel free to fill out our contact form.

  • Stocks Mixed, Commodities Down; USD Up

    Heretofore, the action since this rally was confirmed on the September 1, 2010 follow-through day (FTD) has been strong but the market action has been wide-and-loose which is not a healthy sign. The S&P 500 sliced below its two month upward trendline (shown above) which is not ideal. The next level of support for the major averages is their September highs, then their respective 200-day moving average (DMA) lines while the next level of resistance is their respective April highs. We have enjoyed large gains since the September 1st FTD and for the first time, the tape is getting sloppy. Trade accordingly.

  • Risk Assets Rally on A Slew Of Headlines

    Market Outlook- Rally Under Pressure:
    The current rally is under pressure due to the recent severe sell off that sent the SPX below 1230 and erased half of October’s gains. This means that caution is king until the bulls regain control of this market. In addition, it is important to note that the bulls failed to send the major averages above their respective 200 DMA lines and the neckline of their ominous head-and-shoulders top pattern (1250) in late October. We have to expect this sloppy, wide and loose action to continue until that level is repaired and higher prices follow. Our longstanding clients/readers know, we like to filter out the noise and focus on what matters most: market action. If you are looking for specific help navigating this market, please contact us for more information.
    Stop Chasing Stocks,
    Let Them Chase You!
    Join FindLeadingStocks.com Today!