Stocks End Busy Week Higher

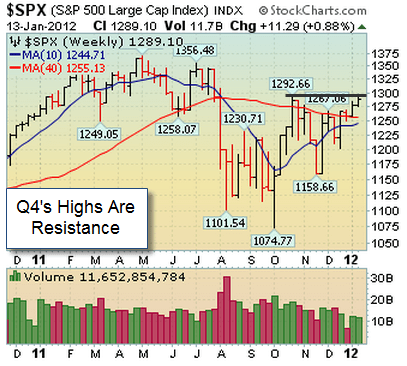
SPX- Q4's Highs Are Resistance

Friday, January 13, 2012
Stock Market Commentary:

Stocks and a slew of other risk assets ended the week higher shrugging off France’s downgrade (which made lose its AAA rating) and investors digested a slew economic and earnings data. From our point of view, the major averages confirmed their latest rally attempt on Tuesday 1.3.12 which was Day 9 of their current rally attempt. It was also encouraging to see the S&P 500 break above its downward trendline and its longer term 200 DMA line (shown above). Looking forward, the next area of resistance remains Q4’s highs (~1292) and then 2011 highs near 1370. In addition, the bulls remain in control as long as the benchmark S&P 500 trades above  its 200 DMA line.

Monday-Wednesday: Stocks Rally Ahead of EU Meeting

Stocks were relatively quiet on Monday as EU leaders met to discuss their debt problems and Alcoa officially kicked off Q4 earnings season. In Europe, French President Sarkozy and Germany’s PM Merkel met and said they want to complete their negotiations on a new treaty in the coming days so it could be signed by March 1, 2012. Meanwhile, Germany sold 3.9 billion euros ($4.9 billion) in six-month T-Bills with a negative yield for the first time in modern history. After the bell, Alcoa kicked off earnings season when they released their Q4 results. As always, it is very important to focus on how stocks react to earnings and not just the earnings. There have been many examples were the numbers are horrid but the stock gaps up and charges higher for the next few quarters and the converse is also true.
Stocks opened higher on Tuesday as Q4 earnings season kicked into gear. We also tell our clients that price is primary and everything else (even earnings) is secondary. Investors were also happy to see that for the second consecutive month, small-business optimism rose in the U.S. The National Federation of Independent Business Optimism Index rose to 93.8 in December which is 1.8 points higher than November’s reading and 5.7 points higher than September 2011. Elsewhere, wholesale inventories corrected in November to 0.1% which was down from October’s reading of +1.2%.
Stocks were mixed on Wednesday as the world awaited Thursday’s ECB meeting. In the U.S., a handful of companies released their Q4 results which largely met estimates. At 2pm EST, the Federal Reserve released its Beige Book which measures the economy at each branch in its 12 districts around the country. The Beige Book is released roughly two weeks before the next FOMC meeting and is used to gauge the overall health of the economy. The report showed that the U.S. economy grew albeit at a slower pace than Fed officials would like to see.

Thursday- Friday’s Action: ECB & BOE Meet, U.S. Economic Data Fails To Impress & France is Downgraded!

Before Thursday’s open, investors digested a slew of data. Overseas, The Bank of England held rates steady and said they would not print more money in the foreseeable future which was a backhanded vote of confidence for their economy. Meanwhile, the ECB also held rates steady which put pressure on European politicians to resolve their ballooning debt crisis. Spain and Italy both held successful bond auctions which helped alleviate short term refinancing fears. U.S. economic data failed to impress. First, weekly jobless claims topped estimates and rose by +24,000 to a seasonally adjusted 399,000 which was the highest level in six weeks and very close to the closely followed 400,000 mark. The four-week average also jumped to 381,750 from 374,000 in the prior week. Separately, the Commerce Department said retail sales rose +0.1% last month which fell short of the Street’s estimate for a gain of +0.3%. It was also the weakest reading in seven months. Finally, the Commerce Department said businesses inventories grew by +0.3% in November. Stocks slid on Friday after S&P cut several European nation’s credit ratings due to their ballooning debt.

Market Outlook- New Rally Confirmed

Risk assets (stocks, FX, and commodities) have been acting better since the latter half of December. Now that the major U.S. averages scored a proper follow-through day the path of least resistance is higher. Looking forward, one can err on the long side as long as the benchmark S&P 500 remains above support (1260). Leadership is beginning to improve which is another healthy sign. Now that the 200 DMA line was taken out it will be important to see how long the market can stay above this important level. If you are looking for specific help navigating this market, feel free to contact us for more information. That’s what we are here for!

Similar Posts

  • Week In Review: Bulls Emerge Victorious in July

    Bulls Emerge Victorious in July July 2015 was a volatile month as investors had to navigate two potential external shocks (Greece and China) and digest the latest round of economic and earnings data. After all was said and done, stocks ended the week and month higher after successfully testing critical support (bottom of the year-long trading…

  • Stocks Close Below 200 DMA Line

    Technically, the fact that both the Dow Jones Industrial Average and the S&P 500 Index closed below their respective 200-day moving average (DMA) lines suggests the market may retest its recent lows. Looking forward, the 50 DMA line should now act as resistance and this month’s lows should act as support. Since last Tuesday’s FTD, this column has steadily noted the importance of remaining very selective and disciplined because all of the major averages are still trading below their downward sloping 50-day moving average (DMA) lines. This week’s sell off simply confirms that view. Trade accordingly.

  • Lousy Week For Stocks

    Friday, July 15, 2011
    Stock Market Commentary:
    Stocks ended lower for the week but managed to stay near their respective 50 DMA lines which is an encouraging sign. The benchmark S&P 500 index sliced and closed below its 50 DMA line on Thursday which is not ideal. Meanwhile, the Dow Jones Industrial Average and the tech heavy Nasdaq composite managed to stay above their respective 50 DMA lines. Once all the major averages violate their respective 50 DMA lines, the rally will end and the bears will have regained control of this market. Looking forward, the next level of resistance is their respective 2011 highs.
    Monday- Wednesday’s Action: Stocks Slide On Debt Woes
    Over the weekend, fresh debt concerns surfaced from the U.S. and Europe which put pressure on stocks and a slew of commodities. In Europe, an emergency session was held to discuss Italy’s mounting debt woes. Before Tuesday’s open, the euro was smacked as fresh debt woes surfaced throughout Europe and the debt/deficit situation in the U.S. remains unresolved. Euro zone finance ministers promised a more flexible approach to deal with Greece and other troubled nations. However, markets across the world did not believe their rhetoric. A newspaper report showed that six Spanish banks failed the EU stress tests which are slated to be released on Friday. Elsewhere, the U.S. trade deficit soared to a 3 year high in May thanks in part to lower exports. The Commerce Department said the deficit surged +15.1% to +50.2 billion in May which is the largest imbalance since October 2008.
    At 2pm EST, the minutes of the Federal Reserve’s June meeting were released and showed that Fed officials did not rule out QE3. Stocks sold off after a short-lived initial bounce on the news. Shortly after the Fed minutes were released, Moody’s rating agency downgraded Ireland’s debt rating to junk which sent stocks lower. Finally, Alcoa (AA) officially kicked off earnings season after Monday’s close when they released their Q2 results. Needless to say, it will be interesting to see how the major averages react to earnings over the next few weeks.
    Before Wednesday’s open, China said its gross domestic product (GDP) slowed to a rather strong +9.5% last quarter. This was slightly lower than Q1′s strong reading of +9.7% but slightly higher than the Street’s +9.4% expectation. It is important to note that Beijing has been rather vocal in their attempts to curb inflation and their red-hot economy. In the U.S., Ben Bernanke made it abundantly clear that the Fed is willing to step up and ease monetary policy (i.e. QE 3) again, “if needed.” This sent the dollar lower and a slew of dollar denominated assets (i.e. risk assets) higher. On a rather sad note, a series of bombs rocked the financial district of Mumbai, killing at least 21 people and injuring 141 in what most believe to a terrorist attack.
    Thursday & Friday’s Action: 50 DMA line Is Support!
    On Thursday, investors digested a slew of economic data, most of which topped estimates. The Labor Department said, weekly jobless claims fell -22,000 to 405,000 last week which is much closer than to the closely followed 400,000 mark. The latest read on inflation was tame which helped ease pressure on the Fed to raise rates in the near future. The producer price index (PPI) fell -0.4% which was below the -0.3% forecast.
    Retail sales rose +0.1% which topped the unchanged reading expected by Wall Street. Bernanke spent most of his day testifying on Capital Hill where he made it clear that he was not immediately ready to embark on QE 3. Stocks immediately sold off on the news. The pressure in D.C. is palpable regarding the ongoing debt/deficit talks. The President knows that the country is at a critical juncture and if this issue is not resolved swiftly the ramifications will be ominous, it will tarnish his legacy, and most likely cost him a second term in office. After Thursday’s close, Google (GOOG) surged over 10% after smashing Q2 estimates which bodes well for Q2 earnings season.
    Before Friday’s open, Citigroup (C) reported stronger than expected Q2 results which bodes well for the ailing financial sector. Economic data was mixed. The consumer price index (CPI) slid -0.2% which matched the Street’s estimate. Core CPI, which excludes food and energy, rose +0.25%. Elsewhere, the Empire State Manufacturing Index fell -3.76 last month which fell short of the Street’s estimates and consumer confidence tanked to the lowest level since March 2009!
    Market Outlook- Uptrend Under Pressure:
    The last week of June’s strong action suggests the market is back in a confirmed rally. As our longstanding clients/readers know, we like to filter out the noise and focus on what matters most: market action. That said, the current rally is under pressure as investors patiently await earnings season and continue to digest the latest economic data. Until all the major averages violate their respective 50 DMA lines on a closing basis, the market deserves the bullish benefit of the doubt. If you are looking for specific help navigating this market, please contact us for more information.
    Stock Market Research?
    Global Macro Research?
    Want To Follow Trends?
    Learn How We Can Help You!

  • Day 2: Stocks Rally As Inflation Eases

    Market Outlook- Market In A Correction:
    From our point of view, the market is back in a correction now that all the major averages closed below their respective 50 DMA lines and important upward trendlines. Since the beginning of May, we have urged our clients and readers to be extremely cautious as the major averages and a host of commodities began selling off.
    For those of you that are interested, the S&P 500 hit a new 2011 high on May 2, 2011. Two days later, on Wednesday, May 4, 2011, we turned cautious and said “The Rally Was Under Pressure” (read here). Then on Monday, 5.23.11, we changed our outlook to “Market In A Correction” (read here). On Monday June 6, 2011 we pointed out that the S&P 500 violated its 9-month upward trendline (read here) and reiterated our cautious stance. We have received a lot of “thank you” emails for being “spot on” in our cautious approach. We are humbled by your presence and very thankful for your continued support. Looking forward, the next level of resistance for the major averages is their respective 50 DMA lines then their 2011 highs. The next level of support is their longer term 200 DMA lines. If you are looking for specific help navigating this market, please contact us for more information.
    Stock Market Research?
    Global Macro Research?
    Want To Follow Trends?
    Learn How We Can Help You!

  • Week-In-Review: Stocks Resilient Despite Crummy Jobs Report

    Stocks Resilient After Crummy Jobs Report Stocks opened lower but closed near their highs after the jobs report disappointed and missed estimates by a rather large margin. We have seen this pattern all week, (open lower and close near the highs) which is a subtle but important sign of strength. The Labor Department said U.S….

  • Rally Ends; Stocks Smacked

    Market Outlook- Market In A Correction:
    The market is back in a correction after another failed follow-through day on Tuesday, June 21, 2011. Now that we are back in a correction, defense remains the best offense. The next level of support for the major averages are their respective 200 DMA lines and then their March lows. The next level of resistance for the major averages is their respective 50 DMA lines. Trade accordingly.
    For those of you that are interested, the S&P 500 hit a new 2011 high on May 2, 2011. Two days later, on Wednesday, May 4, 2011, we turned cautious and said “The Rally Was Under Pressure” (read here). Then on Monday, 5.23.11, we changed our outlook to “Market In A Correction” (read here). On Monday, June 6, 2011 we pointed out that the S&P 500 violated its 9-month upward trendline (read here) and reiterated our cautious stance. On June 21, 2011 we changed our Market Outlook to a “Confirmed Rally” after the latest FTD was produced. Two days later, on Thursday, June 23, 2011, our outlook changed to “Market In A Correction” after the market sold off hard on renewed economic woes. If you are looking for specific help navigating this market, please contact us for more information.
    Stock Market Research?
    Global Macro Research?
    Want To Follow Trends?
    Learn How We Can Help You!