
Investors Digest More Earnings & Economic Data
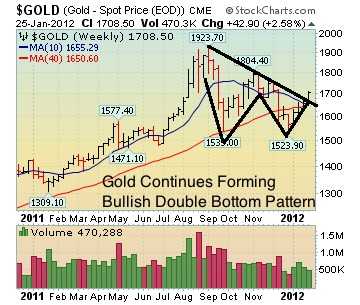
Gold Continues Forming A Bullish Double Bottom Pattern

Thursday, January 26, 2012
Stock Market Commentary:

Stocks and a slew of other risk assets opened higher after the U.S. Federal Reserve made it clear that they are going to keep rates near zero until 2014. From our point of view, the major averages confirmed their latest rally attempt on Tuesday 1.3.12 which was Day 9 of their current rally attempt. It was also encouraging to see the S&P 500 break above its downward trendline and its longer term 200 DMA line. Looking forward, the S&P 500 is doing its best to stay above its Q4 2011’s high (~1292) and now has its sights set on its 2011 highs near 1370. In addition, the bulls remain in control as long as the benchmark S&P 500 trades above  1292 and then its 200 DMA line.

Easy Money, Earnings & Economic Data Helps Stocks:

On Thursday, stocks and a slew of risk assets opened higher but were quiet in the wake of the Federal Reserve’s latest meeting. The Fed made it clear that they are going to hold rates steady near zero until 2014 to help the global economy recover. The latest economic and earnings data was mixed to slightly positive which also helped stocks. Durable goods rose 3% which easily topped the Street’s estimate for a 2% gain. Meanwhile, the Labor Department said weekly jobless claims rose by 21,000 to 377,000 which topped the Street’s estimate for a gain of 370,000. Leading economic indicators rose to a 5-month high which bodes well for the economy. However, new home sales unexpectedly fell -2.2% to a seasonally adjusted annual rate of 307,000, which was the first decline in 4 months and lower than the Street’s estimate.
THURSDAY: Durable goods orders, jobless claims, new home sales, leading indicators, 7-yr note auction; Earnings from AT&T, Caterpillar, 3M, Nokia, AutoNation, Bristol-Myers, Time Warner Cable, Motorola Mobility, Starbucks
FRIDAY: GDP, consumer sentiment; Earnings from Chevron, P&G, DRHorton
Source CNBC.com:

Market Outlook- New Rally Confirmed

Risk assets (stocks, FX, and commodities) have been acting better since the latter half of December. Now that the major U.S. averages scored a proper follow-through day the path of least resistance is higher. Looking forward, one can err on the long side as long as the benchmark S&P 500 remains above support (1292). Leadership is beginning to improve which is another healthy sign. Now that the 200 DMA line was taken out it will be important to see how long the market can stay above this important level. If you are looking for specific help navigating this market, feel free to contact us for more information. That’s what we are here for!
 

Similar Posts

  • Week In Review: Historic Week On Wall Street

    Wild Week On Wall Street It was a historic and very wild week on Wall Street with record point moves (up and down) almost everyday of the week. Typically, massive sell-offs do not recover overnight. Additionally, massive selloffs  followed by record volatility leads to lower, not higher prices – especially when they occur in aging bull…

  • Stocks & Commodities Smacked As EU Debt Woes Continue

    Heretofore, the action since this rally was confirmed on the September 1, 2010 follow-through day (FTD) has been strong but the market action has been wide-and-loose which is not a healthy sign and has caused the major averages to all pullback to their respective 50 DMA lines. This is the next important level of support for the major averages and several leading stocks. It is of the utmost importance for the bulls to show up and defend the 50 DMA line in order for this rally to remain intact. Caution and patience is key at this point. Trade accordingly.

  • Strong Open After MLK Weekend

    For the most part, the major averages and leading stocks are acting well as investors continue to digest the slew of economic and earnings data being released each day. Until a clear picture can be formed as to how companies fared last quarter, one could easily expect to see more of this sideways action to continue. The market just began its 46th week since the March lows and the rally remains intact as long as the major averages continue trading above their respective 50-day moving average (DMA) lines.

  • Holding Pattern Continues As Market Awaits New Year

    Before Thursday’s open, the Labor Department said weekly jobless claims fell to the lowest level since July 2008 which was a healthy sign for the ailing jobs market. Last week, jobless claims fell by -34,000 to 388,000, lower than the median forecast of 415,000 according to Bloomberg News. After the open, the Chicago PMI topped estimates and rose to 68.6 which bodes well for the ongoing economic recovery. At 10 AM EST, the National Association of Realtors (NAR) said their pending home sales index topped estimates and rose +3.5% to 92.2 from a downwardly revised 89.1 in October. Pending home sales indicate pending contracts that have yet to be closed. The market barely budged on the news which reiterates our thesis that the major averages are in a tight holding pattern until 2011. However, the recent 4-month rally in the major averages suggests the economy will continue to improve in the first half of 2011 and, barring some unforeseen event, the risk of a double dip recession is temporarily off the table. Normally, the stock market serves as a leading indicator and a great discounting mechanism for the economy.