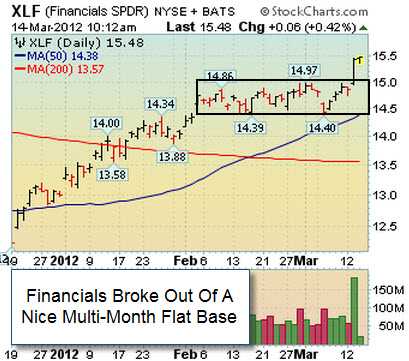
Stocks Digest Tuesday's Strong Move

XLF- Broke out of a nice flat base

Wednesday, March 14, 2012
Stock Market Commentary:

Stocks opened higher on Wednesday, led by the explosive post Stress-test results from the country’s largest banks. From our point of view, the major averages confirmed their latest rally attempt on Tuesday 1.3.12 which was Day 9 of their current rally attempt. Since then, stocks have been enjoying a very strong uptrend. The benchmark S&P 500 paused near its 2011 high (~1370) before moving higher. It would be perfectly normal and healthy to see a 5-9% pullback at any point to give the bulls a chance to consolidate the recent gain. That would bring the S&P 500 down to 1310-1250. Until then, the bulls remain in control of this market as long as the benchmark S&P 500 stays above its 50 DMA line.

Financials Lead, Economic Data Helps:

Before Wednesday’s open, the government said import prices fell short of the Street’s estimate, rising +0.4% in February thanks to a large drop in food prices. Meanwhile, the U.S. current account deficit, jumped to a three-year high of $124.1 billion. A separate report showed that the Mortgage Bankers Association said demand for home loans slid by -2.4% but actually rose 4.4% excluding a drop in refinancing requests last week.

Market Outlook- Confirmed Rally

After a very shallow pullback the majority of risk assets (Stocks, FX, and commodities) have began to rally. So far this action is considered healthy for the risk on trade. However, if the sellers show up and support is breached then the bears will have regained control of this market. As always, keep your losses small and never argue with the tape. If you are looking for specific help navigating this market, feel free to contact us for more information. That’s what we are here for!

Similar Posts

  • Day 1 Of A New Rally Attempt

    Stocks took a heavy beating on Thursday, sending all the major averages below their respective 200 DMA lines on heavy volume. Stocks ended higher on Friday after the S&P 500, Russell 2000 and Nasdaq Composite all shook out below their May 6, 2010 (flash crash) low. For the week, all the major averages suffered tremendous losses and fell over -10% from their late April highs, which is the first time a pullback of that magnitude has occurred since the March 2009 low. The fact that the market rallied on Friday technically marked Day 1 of a new rally attempt which means the earliest a proper follow-through day (FTD) could occur would be Wednesday, providing Friday’s lows are not breached. However, if at anytime, Friday’s lows are breached, then the day count will be reset. What does all of this mean for investors? Simple, the market remains in a correction which reiterates the importance of adopting a strong defense stance until a new rally is confirmed. Trade accordingly.

  • Earnings Miss; Stocks React

    Market Outlook- In A Correction:
    The major U.S. averages are still in a “correction” as they continue to bounce towards resistance of their 2-month base. The latest follow-through day (FTD) which began on August 23, 2011 has officially ended which means we will continue “counting” days before a new rally can be confirmed. In addition, it is important to note that the bulls scored a victory since many of the major averages closed above their downward sloping 50 DMA lines for the first time since late July! The next stop is September’s highs and then their 200 DMA lines. Our longstanding clients/readers know, we like to filter out the noise and focus on what matters most: market action. . If you are looking for specific help navigating this market, please contact us for more information.
    Fall Sale- We Will Double Your Order!!!
    Limited-Time Offer!
    www.FindLeadingStocks.com

  • Stocks Bounce; Volatility Continues!

    Market Outlook- Rally Under Pressure:
    The current rally is under pressure due to the recent severe sell off that sent the SPX below 1230 and erased half of October’s gains. This means that caution is king until the bulls regain control of this market. In addition, it is important to note that the bulls failed to send the major averages above their respective 200 DMA lines and the neckline of their ominous head-and-shoulders top pattern (1250) in late October. We have to expect this sloppy, wide and loose action to continue until that level is repaired and higher prices follow. Our longstanding clients/readers know, we like to filter out the noise and focus on what matters most: market action. If you are looking for specific help navigating this market, please contact us for more information.
    Stop Chasing Stocks,
    Let Them Chase You!
    Join FindLeadingStocks.com Today!

  • Russell 2000 Hits Fresh Record High!

    Market Action-Confirmed Uptrend
    The market is back in a confirmed uptrend after a modest (and healthy) -6% correction from its post-recovery highs. We find it very bullish to see the mid cap S&P 400 index hit a fresh all time high and the small cap Russell 2000 index flirt with its all time high. in addition, the Dow Jones Industrial Average vaulted to a fresh post-recovery high and the S&P 500 and Nasdaq composite are just shy of fresh 2011 highs! Finally, we are very happy to see a slew of high ranked stocks trigger fresh technical buy signals in recent weeks which suggests higher, not lower prices lie ahead. If you are looking for specific help navigating this market, please contact us for more information.