Week-In-Review: Bulls Defend Support…For Now

Bulls Defend Support…For Now

This was an important week on Wall Street. The Bulls showed up and defended the longer-term 200 DMA line which is important support for the major indices. Stocks ended lower last week as fear spread that a trade war may derail the global economy and adversely affect corporate earnings. This is a critical time for the market because if support can’t hold, then odds favor this turns into a large top and we could easily fall into a long-overdue bear market. For now, the next two important areas to watch are the 200 DMA lines and then Feb’s low. To keep it really simple, as long as support holds, we are likely to move sideways or higher. Conversely, if Feb’s lows are breached then odds favor we are going to fall the dreaded -20% which would signal a bear market. The next big catalyst is earnings season which is supposed to be strong. So if earnings fail to impress- that could also hurt the market. 

Mon-Wed Action:

Stocks were smacked hard on Monday causing the market to experience its worst start to the second quarter since the Great Depression. At one point, the Dow was down over 700 points but, thanks to a late day rally, ended down over 500 points. That may have been an important near term low for the market as many bulls finally capitulated and the market successfully tested important support (200 DMA line for the S&P 500). Stocks snapped back and rallied over 300 points on Tuesday as investors stepped in and defended important areas of support. In other news, Spotify finally IPO’d and it came out higher than the expected range. One should be careful with high profile IPOs because most of them do not act well on Day 1. Wednesday was an important day on Wall Street because overnight China announced they would issue tariffs on 106 U.S. products and futures fell over 500 points. On cue, the bulls showed up and defended support helping the market close higher by over 200 points.

Thur & Fri Action:

On Thursday, stocks continued to bounce as the bulls showed up and added to Wednesday’s rally. On the economic front, weekly jobless claims came in at 242,000, higher than the Street’s estimate for 225,000. Even the slight uptick was written off because claims are still near their lowest levels since the 1970s. Before Friday’s open, the Labor Department said U.S. employers added 103k new jobs which missed estimates for 175k. Separately, the threat of the trade war increased after the rhetoric between Beijing and the White House intensified.

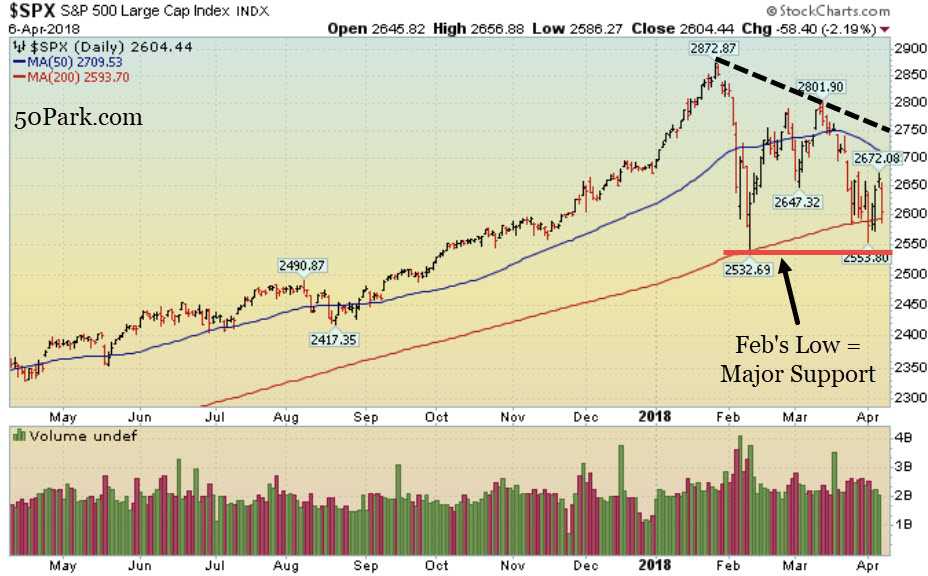
Market Outlook: Bulls Try To Defend Support

The market is trading between important resistance (2018’s high) and important support (February’s low). Until either level is broken, I have to expect this sloppy, sideways action to continue. The big level of support to watch is February’s low and the 200 DMA line for the major indices. For now, as long as those levels hold, the longer-term uptrend remains intact. Conversely, if those levels break, look out below. As always, keep your losses small and never argue with the tape. Want 1-0n-1 Coaching Lessons From Adam? Click Here To Learn More

Similar Posts

  • The Sideways Action Continues

    Market Outlook- Market In A Correction
    The latest action in the major averages suggests the market is back in a correction as all the major averages remain below key technical levels. Our longstanding clients/readers know, we like to filter out the noise and focus on what matters most: market action. That said, the recent action suggests caution is paramount at this stage until all the major averages rally back towards their respective 200 DMA lines. If you are looking for specific help navigating this market, please contact us for more information.

  • Weak Economic Data Drags Stocks Lower

    Monday marked Day 2 of a new rally attempt which means the earliest a possible follow-through day (FTD) could emerge will be Wednesday. However, if at anytime, Friday’s lows (Day 1) are breached then the day count will be reset. The technical action in the major averages has recently been weak while the latest round of economic data has provided a poor outlook for the market and the global recovery. Currently, resistance for the the major averages are their 50-day moving average (DMA) lines, then their longer-term 200 DMA lines while support remains July’s lows. It is also disconcerting to see weakness in the financial group. Meanwhile, the action in leading stocks and fact that some high-ranked leaders are breaking out of sound bases can be considered somewhat encouraging. Still there is importance in remaining cautious until the major averages are back in a confirmed uptrend. Put simply, we can expect this sideways/choppy action to continue until the market breaks out above resistance or below support. The first scenario will have bullish ramifications while the second will be clearly bearish. Trade accordingly.

  • Resistance is Broken!

    Market Outlook- Confirmed Rally:
    The major U.S. averages are back in a new confirmed rally and are flirting with resistance of their current 2.5 month base. The benchmark S&P 500 index scored a proper FTD on Tuesday, October 18, 2011, i.e. Day 12, when it rallied over 2% on heavier volume than the prior session. The next important area of resistance is September’s highs and then the 200 DMA line. In addition, it is important to note that the bulls scored a victory since many of the major averages closed above their downward sloping 50 DMA lines for the first time since late July! Our longstanding clients/readers know, we like to filter out the noise and focus on what matters most: market action. If you are looking for specific help navigating this market, please contact us for more information.
    Stop Losing Money In The Market
    Visit:
    FindLeadingStocks.com

  • QE 3 Is Officially In The Cards; Another Weak Close!

    Market Outlook- Uptrend Under Pressure:
    The last week of June’s strong action suggests the market is back in a confirmed rally. As our longstanding clients/readers know, we like to filter out the noise and focus on what matters most: market action. That said, the current rally is under pressure as investors patiently await earnings season and continue to digest the latest economic data. Until the major averages violate their respective 50 DMA lines on a closing basis, the market deserves the bullish benefit of the doubt. If you are looking for specific help navigating this market, please contact us for more information.
    Stock Market Research?
    Global Macro Research?
    Want To Follow Trends?
    Learn How We Can Help You!

  • Stocks End Flat Ahead of GDP Data

    Heretofore, the action since this rally was confirmed on the September 1, 2010 follow-through day (FTD) has been strong but the market action has been wide-and-loose which is not a healthy sign. The S&P 500 sliced below its two month upward trendline (shown above) which is not ideal. The next level of support for the major averages is their September highs, then their respective 200-day moving average (DMA) lines while the next level of resistance is their respective April highs. We have enjoyed large gains since the September 1st FTD and for the first time, the tape is getting sloppy. Trade accordingly.

Leave a Reply

Your email address will not be published. Required fields are marked *