
Week-In-Review: Stocks End Week Mostly Lower Amid Trade Woes
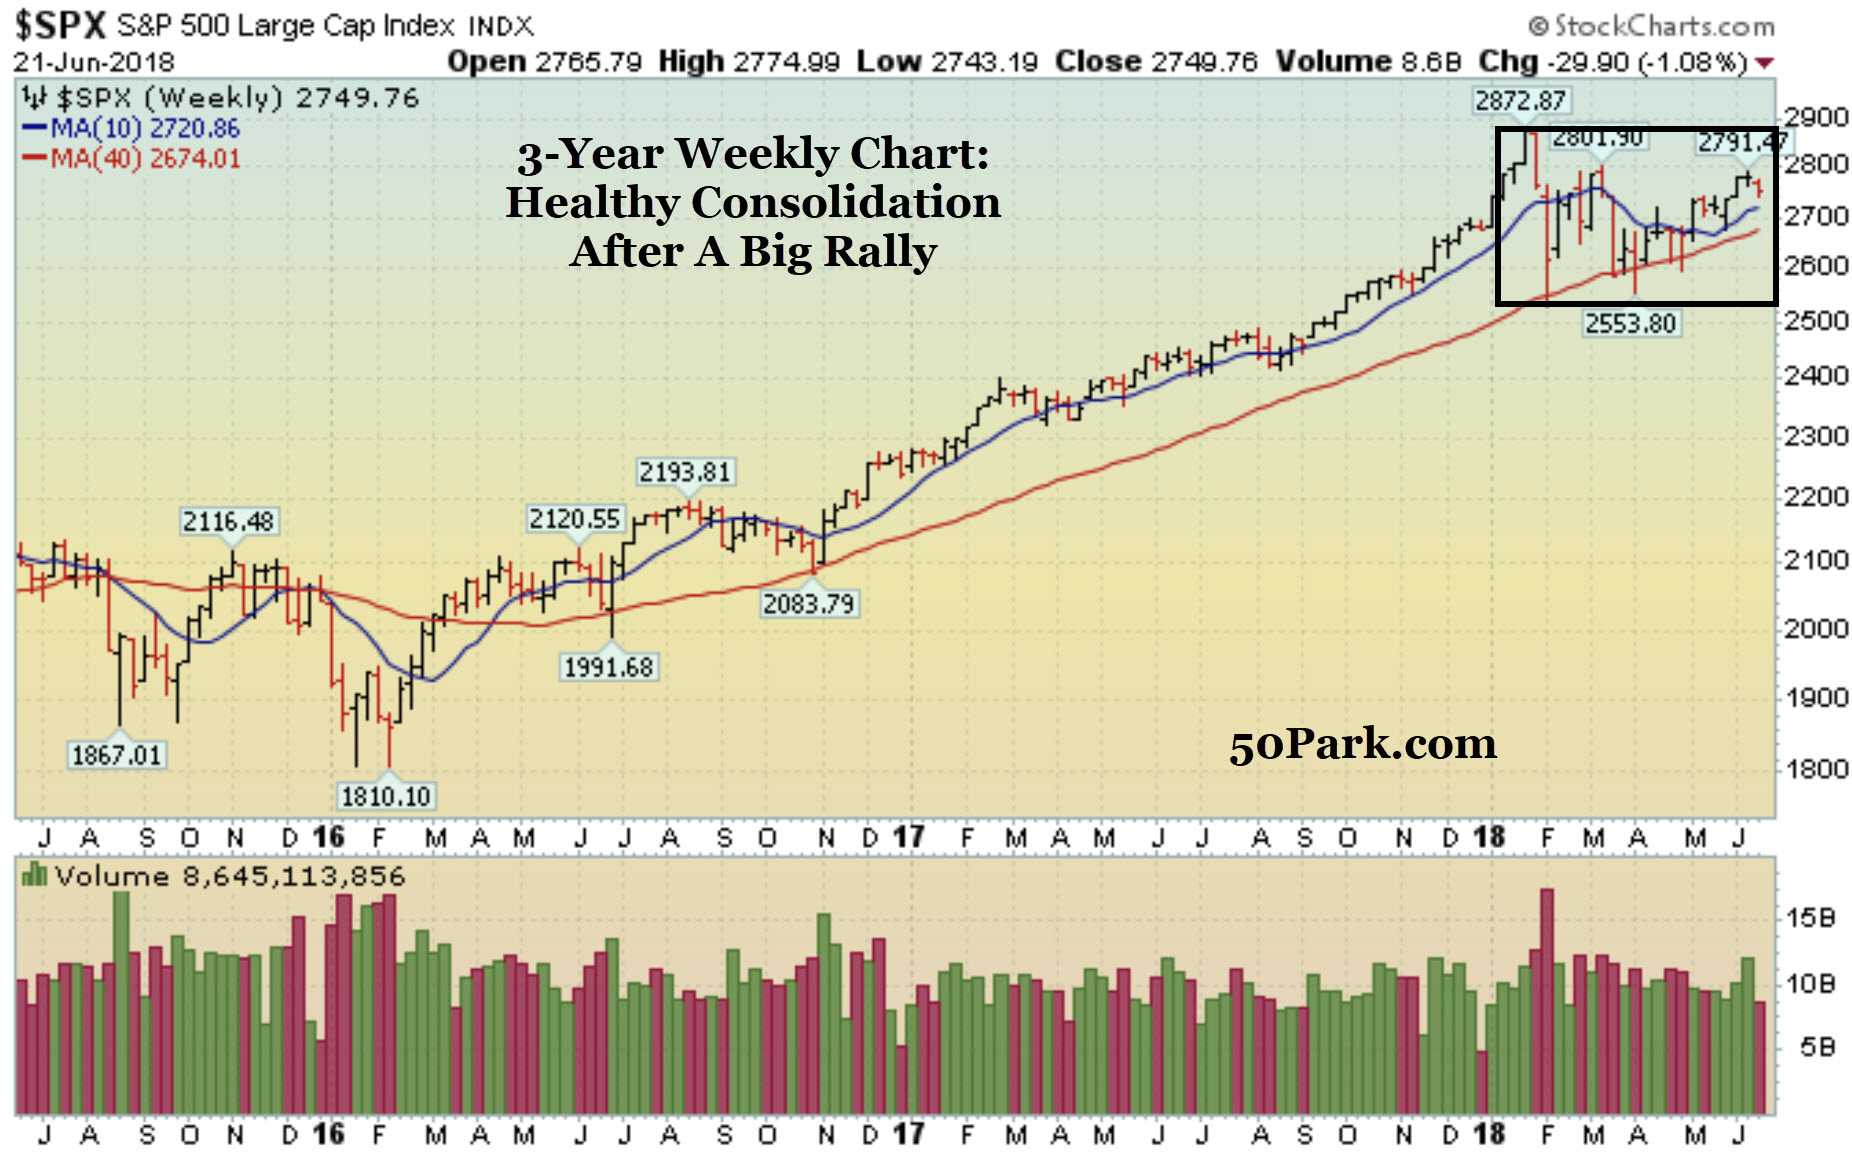
Dow Flirts With 200 DMA Line

The major indices ended mostly lower last week amid the ongoing trade woes. In the first half of the week, President Trump said he will consider adding tariffs on nearly $200 billion worth of Chinese goods. A few days later, China responded by saying, the US has “delusions” regarding the trade war. It is important to put the on going trade dispute between the two economic powerhouses in the proper context. Here are some facts: The US economy is roughly $19T and currently, China only imports $130B of goods from the US. Meanwhile, the US imports $505B from China.  That’s why the administration is doing what it is doing. From my point of view, the only thing that matters is what does all this mean for capital markets? Stepping back, this is mostly noise until we see definitive action. Recently, the Dow has been lagging because it is the most sensitive to the ongoing trade woes. So far, the market – and leading stocks- continue acting well and that tells me everything I want to know. In the short-term the major indices are extended and are pulling back. They key now is to analyze the health of this pullback then go from there. Keep in mind we are approaching the end of the month and the end of the quarter which usually has a slightly upward bias. 

Mon-Wed Action:

Stocks ended mixed on Monday as the Dow and S&P 500 fell but the Nasdaq managed a small gain. The market opened lower after concern grew regarding a potential global trade war. After the close, President Trump said he is prepared to announce tariffs on $200B worth of Chinese goods. Overnight, global equity markets plunged and stocks opened lower on Tuesday. Once again, by the close, the market ended in the middle to upper half of its range which is a somewhat bullish sign. Wednesday was a relatively quiet session. Stocks opened higher on Wednesday but the Dow quickly gave back its gains and turned lower. Separately, Disney raised its bid for Twenty-First Century Fox assets to $38 per share, or $71.3 billion. That was higher than Comcast’s offer of $65 billion in cash for the Fox assets which include FX, Star TV and stakes in Sky.

Thur & Fri Action:

Stocks fell on Thursday on lingering trade concerns. The Dow Jones Industrial Average fell by nearly 200 points and extended its losing streak to 8 days. The last time the Dow fell 9 consecutive days was 40 years ago. Separately,
e-commerce stocks fell on Thursday, after the U.S. Supreme Court allowed states to collect taxes from retailers that do not have a physical presence there. That is a big game changer for the entire e-commerce industry. Stocks were quiet on Friday with the only big headline coming from OPEC. OPEC decided to raise production slightly to help with the oil market.

Market Outlook: Bullish Action

The major indices are pulling back after the Nasdaq and Russell 2000 both just hit fresh record highs. The Dow & S&P 500 are lagging as they are more impacted by global trade woes. On the downside, the big level of support to watch is the 200 DMA line and then February’s low. For now, as long as those levels hold, the longer-term uptrend remains intact. Conversely, if those levels break, look out below.  As always, keep your losses small and never argue with the tape. Free Special Report: Want A Bargain? 3 Cheap Stocks That Are About To Breakout

Similar Posts

  • Stocks Down; Dollar Up

    Wednesday, March 24, 2010 Market Commentary: The major averages, US Treasuries, the euro and a slew of commodities pulled back as the dollar advanced after Portugal’s debt was downgraded by Fitch.The volume total on the NYSE was about even compared to Monday’s totals, while volume was reported slightly higher on the Nasdaq exchange. Decliners led advancers by more than…

  • Stocks Enjoy Best Week of 2010!

    Looking forward, the window is now open for disciplined investors to begin carefully buying high-ranked stocks again. Looking forward, the 200 DMA line should now act as near term support as this market continues advancing, while any reversal would be a worrisome sign. It is important to note that the NYSE composite, benchmark S&P 500 index, and the Dow Jones Industrial Average have now all seen their 50 DMA lines undercut their respective 200 DMA lines which is is known as a “death cross” and has bearish ramifications. In addition, remember to remain very selective because all of the major averages are still trading below their downward sloping 50 and 200 DMA lines and a fresh downward trendline (shown above). It was somewhat disconcerting to see volume remain light (below average) behind the confirming gains. It is important to note that approximately 75% of FTDs lead to new sustained rallies, while 25% fail. In addition, every major rally in market history has begun with a FTD, but not every FTD leads to a new rally. Trade accordingly.

  • Week-In-Review: Santa Arrived Early; Tax Cut Sparks Big Rally On Wall Street

    Santa Comes Early; Tax Cut Sparks Big Rally On Wall Street The major indices continued to trade near record highs as 2017 winds down. So far, 2017 is on track to be the strongest year since 2013. The U.S. economy is the largest its ever been in history and continues to grow. Last week, the…

  • Flurry of M&A News Lifts Stocks

    Tuesday, August 17, 2010
    Stock Market Commentary: The technical action in the major averages is not ideal. Currently, resistance for the Dow Jones Industrial Average is its 200 DMA line, while the Nasdaq composite faces resistance at its 50 DMA line. Meanwhile, the benchmark S&P 500 index managed to close above its 50 DMA line but still faces resistance near its 200 DMA line (1,116) and then its prior chart highs near 1,131. The action in leading stocks remains questionable at best which is another disconcerting sign. Tuesday’s action does not change our cautious outlook. Put simply, we can expect this sideways/choppy action to continue until the market breaks out above resistance or below support (recent chart lows). The first scenario will have bullish ramifications while the second will be clearly bearish. Trade accordingly.

  • 27-Week Rally Continues!

    Market Action- Rally Under Pressure; Week 27 Begins
    It was encouraging to see the bulls show up and defend the major averages’ respective 50 DMA lines in November, January, and late February. From our point of view, the market remains in rally-mode until those levels are breached. The tech-heavy Nasdaq composite and small-cap Russell 2000 indexes continue to lead evidenced by their shallow correction and strong recovery. However, it is important to note that stocks were a bit extended in recent months and this pullback (back to the 50 DMA lines) is very healthy as it shakes out the weaker hands and restores the the health of this bull market. If you are looking for specific high ranked ideas, please contact us for more information.
    Are You Looking For Someone To Manage Your Money?
    Our Private Wealth Management Services Can Help You!

  • Stocks Rally After Hitting Fresh 2010 Lows

    All the major averages sliced below Friday’s lows which effectively ended the current rally attempt and reset the base count. However, the S&P 500 managed to close higher for the day which marked Day 1 of a new rally attempt for that index. In addition, the earliest a proper follow-through day (FTD) could occur would be Friday, providing Tuesday’s lows are not breached. However, if at anytime, Tuesday’s lows are breached, then the day count will be reset. What does all of this mean for investors? Simple, the market remains in a correction which reiterates the importance of adopting a strong defense stance until a new rally is confirmed. Trade accordingly.

Leave a Reply

Your email address will not be published. Required fields are marked *